Hit vs Pageview vs Unique Visitor vs Session: Visitor Counting Metrics Explained (2026)
Written by the MapMyVisitors team — running visitor counters since 2005 · Updated
The short answer: a hit is one request to the server for any file. A pageview is one load of one page. A unique visitor is one distinct browser or device counted once per reporting period. A session is one continuous visit — a group of pageviews that ends after roughly 30 minutes of inactivity. Everything else in web analytics is built on these four counts.
I've been explaining these four words to people since the mid-2000s, and I still get the same confused emails today. Years ago a client called me, thrilled: "We had 40,000 hits yesterday!" He was already drafting a press release. I opened the logs, did the math, and had to tell him it was about 900 actual people… he didn't take it well. That gap — between what a number says and what it measures — is exactly what this glossary is about. Every tool implements these definitions a little differently, which is why GA4, Matomo, and a counter widget will report three different numbers for the same day of traffic. None of them is lying. They're just answering different questions.
Hit
Definition: one request received by the web server for any single file — the HTML document, each image, each stylesheet, each script, each font. The term comes from server log analysis in the 1990s, when a "hit counter" literally counted lines in the access log.
How it's counted: every line in the access log is a hit. A page with 40 embedded resources produces 41 hits per load. CDNs, caching, and HTTP/2 multiplexing all change the count without a single extra human showing up. That's the core problem: hits measure infrastructure chatter, not people.
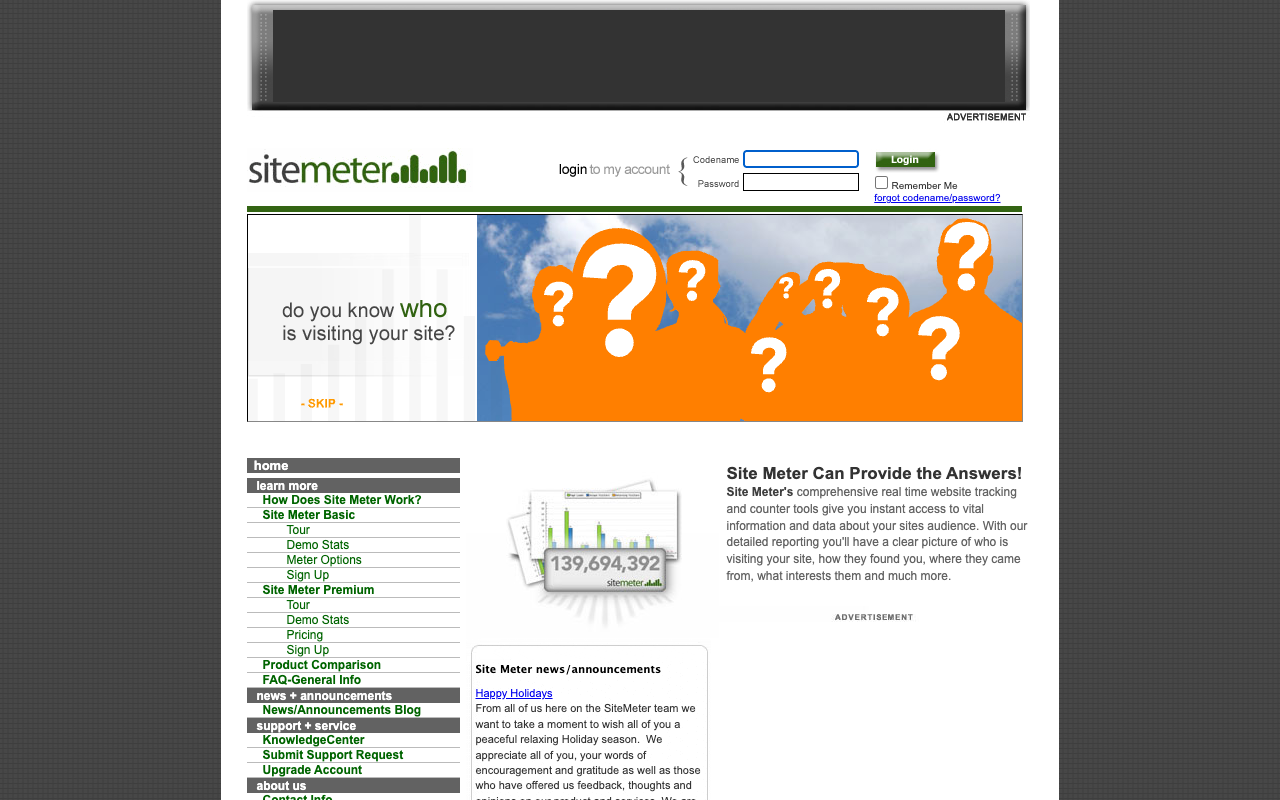
I ran sites through the whole hit-counter era, and I'll admit it: the inflation was the point. "10,000 hits" sounded glorious on a homepage badge even when it meant 250 page loads. Everyone knew, nobody cared. SiteMeter, the tool half the web relied on back then, at least counted visits and page views properly — which is partly why its slow death around 2014 stung so much for those of us who'd built a decade of stats there…
Typical mistakes: treating hits as traffic — that's my 40,000-hits client, and he's had plenty of company over the years. If you want a public-facing counter today, use a visitor counter widget that counts pageviews or unique visitors instead of raw requests. The second classic mistake is the reverse: reading server logs as if bots were people. Crawlers routinely generate a third or more of raw hits, and some days it's worse — I've seen log files where Googlebot outworked my entire audience.
Pageview
Definition: one load — or reload — of a single page in a browser. This is the base volume metric in every modern tool, and it's the unit most analytics pricing is based on — so know exactly what yours is counting.
How it's counted: a JavaScript snippet fires a request to the analytics endpoint when the page loads. On single-page applications the snippet must also fire on route changes (history.pushState), otherwise a 10-minute app session records exactly one pageview and your dashboard tells you everyone leaves instantly. Most tools handle SPA route tracking automatically or via a config flag — verify it before trusting the numbers. Click around three pages, watch three pageviews arrive. Two minutes of checking, months of clean data.
Typical mistakes: double-counting from a tracking snippet pasted twice. This one bites after theme migrations — the new theme ships with an analytics field, someone fills it in, the old hardcoded snippet stays in the footer, and pageviews double overnight while visitors stay flat. I've debugged that exact scenario more times than I can politely say. Also: counting reloads and back-button restores as engagement, and comparing pageviews across tools that disagree on what a "page" even is (with or without query strings, with or without hash fragments).
Unique Visitor
Definition: one distinct person counted once within a reporting period, regardless of how many pages they view or how many times they come back. In practice no tool counts people — it counts browsers or devices. Keep that in your head every time you read a "users" chart.
How it's counted: three identity models dominate. Cookie-based (GA4, Matomo default): a first-party cookie stores a random ID, so return visitors are recognized for up to two years — but the count depends on consent and cookie survival. Hash-based (Plausible, and Matomo in cookieless mode): the tool derives a temporary identifier from IP address and user agent with a salt that rotates daily, so uniqueness holds for about 24 hours and nothing is stored in the browser. A genuinely clever design, by the way. IP-based (counter widgets): one IP counted once per day — the coarsest model, but also the simplest to explain, which counts for something.
Typical mistakes: summing daily uniques to get monthly uniques — a visitor who shows up 20 days counts 20 times, and I've watched people present that sum to management with a straight face. Comparing cookie-based uniques with hash-based uniques is another one: the hash numbers run higher over long periods because returning visitors reset daily. And don't forget that one person on a phone and a laptop is two unique visitors in every model. Every single one.
Session
Definition: a group of pageviews and events from one visitor within one continuous visit. Sessions are the denominator for bounce rate, conversion rate, and traffic attribution — which makes them the metric where tool differences hurt most. Get sessions wrong and everything downstream is wrong with them.
How it's counted: the near-universal rule is a 30-minute inactivity timeout. Any pageview or event within 30 minutes of the last one extends the session; a longer gap starts a new one. The edge cases are where tools go their separate ways. Universal Analytics restarted sessions at midnight and on every campaign source change; GA4 dropped both rules (one of the few GA4 changes I'll actually defend). Matomo still cuts visits at midnight by default. Campaign attribution ties in here too: tagged URLs decide which source a session gets credited to, and utm_id lets you tie a session back to a specific campaign definition — our UTM builder covers the parameters and the naming discipline they need.
Typical mistakes: reading "sessions" as "visitors" — one visitor can produce five sessions in a day. Comparing session counts across tools with different timeout and reset rules. And my personal favorite: assuming a session survives a consent refusal. Without storage, some tools can't stitch pageviews into sessions at all, and every pageview quietly becomes its own visit…
Bonus Metrics: Bounce Rate and Visit Duration
Bounce rate classically means single-pageview sessions divided by all sessions. Then GA4 came along and replaced it with the inverse of engagement rate: a session bounces if it lasted under 10 seconds, triggered no conversion, and had fewer than two pageviews. Same word, different math. A blog where readers arrive, read one article for four minutes, and leave shows a 90% classic bounce rate and a far lower GA4 bounce rate — on identical traffic. I spent an embarrassing chunk of my GA4 migration trying to reconcile those two numbers before accepting they were never going to agree (don't ask how long that took). Never compare bounce rates across tools without checking the definition first.
Visit duration is the time between the first and last recorded interaction in a session. The catch: without an exit ping, the last page contributes zero seconds — so a one-page session has a duration of 0:00 no matter how long the visitor actually read. Tools that send heartbeat or visibilitychange events report longer, more realistic durations. Treat duration as a relative trend metric, not an absolute measure of attention. It's a thermometer, not a stopwatch. The one duration-adjacent number I've stopped distrusting is engagement time as Statable computes it: the clock runs only while the tab is focused and visible (it listens to focus, blur, and visibility changes), so a tab parked in the background for an hour adds nothing. Still not a stopwatch — but at least it stops when the reader does.
How Different Tools Define the Same Metrics
Same traffic, five tools, five sets of numbers. I keep a version of this table pinned above my desk, and here's the 2026 edition:
| Metric | GA4 | Matomo | Plausible | Statable | Counter widgets |
|---|---|---|---|---|---|
| Unique visitor | "Active users" via first-party cookie (+ Google signals where enabled) | Cookie by default; optional cookieless mode with ~24h rotating config hash | Daily-rotating salted hash of IP + user agent; no cookies | Cookieless, no fingerprinting; nothing stored in the browser | Usually one IP per 24h |
| Pageview | page_view event; SPA tracking via enhanced measurement |
Tracked pageview; SPA via manual trackPageView calls |
Pageview; SPA route changes tracked automatically | Pageview incl. SPA route changes (wraps pushState automatically); every one counted, none sampled |
Widget load = one view |
| Session | 30-min inactivity timeout; needs cookie consent to stitch | 30-min timeout; visits also cut at midnight | 30-min timeout, derived from the daily hash | 30-min timeout, resolved server-side without cookies | Typically not measured |
| Bounce rate | Inverse of engagement rate (<10s, no conversion, <2 views) | Classic: single-page visits / all visits | Classic: single-page visits / all visits | Classic: single-page sessions / all sessions | Not measured |
| Sampling / thresholding | Thresholding in reports; sampling possible in explorations | None (self-hosted or cloud) | None | None | None |
Every definition and price in this table verified against the vendors' own documentation and pricing pages in May 2026.
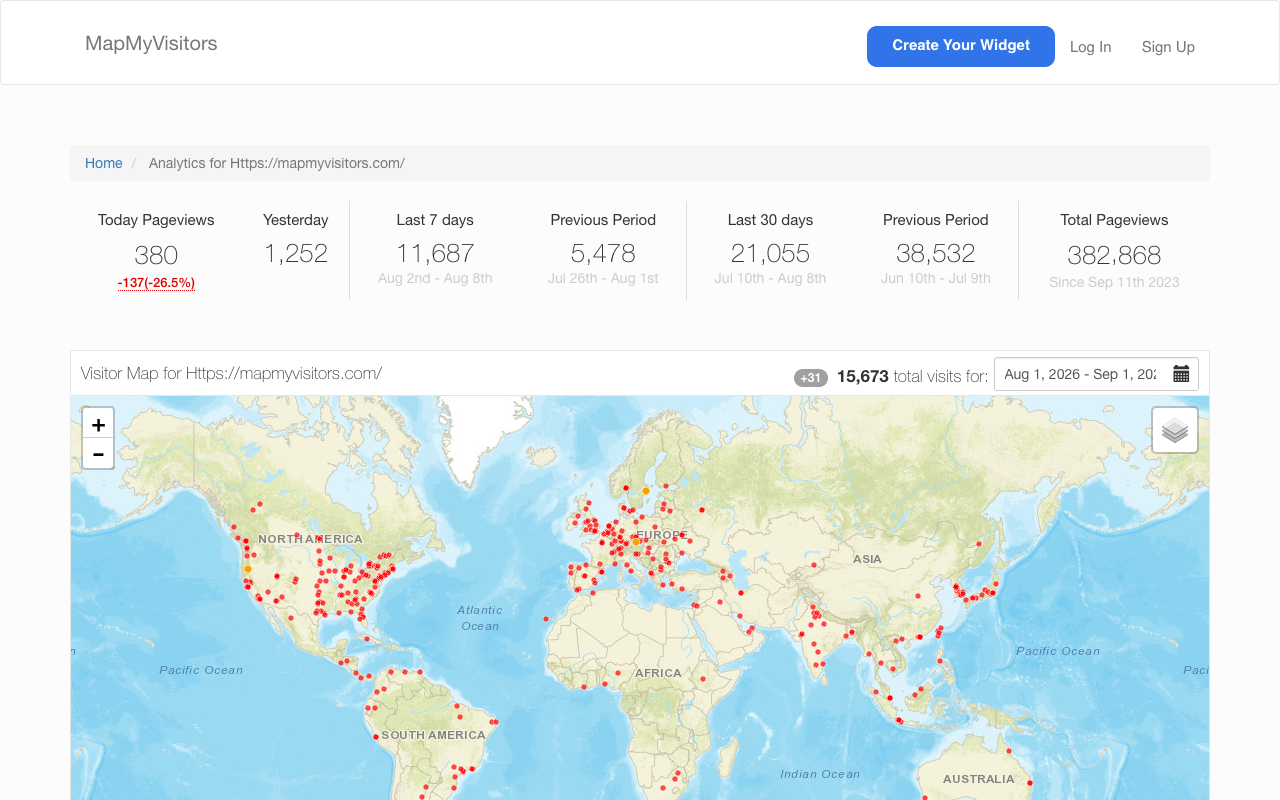
The sharpest divergence, in my experience, is sessions under consent constraints. GA4 needs its cookie to stitch pageviews into a session; decline the banner and attribution falls apart. Plausible's daily-hash approach sidesteps the cookie entirely and I respect the engineering behind it. Statable goes one step simpler still: a pageview either continues an active session or starts a new one, server-side, no cookies, no sampling or thresholding applied afterward — which makes it the easiest model in this table to reconcile against raw server logs (I've done that reconciliation by hand, and with GA4 it's an afternoon of squinting; here it just… matches). The practical consequences: no consent banner is required for the counting itself, the numbers you see are the numbers collected, and the tracking script stays around 2.1 KB — 2,181 bytes brotli-compressed off the CDN, by my own measurement. Data is processed in the EU (Amsterdam); plans start at $9/month for 10K pageviews with unlimited websites and a 30-day trial without a card. Counter widgets like MapMyVisitors (our own tool) sit at the other end of the spectrum: no dashboards to configure, one embeddable map, IP-based daily uniques — a display instrument rather than a measurement suite. Different jobs, folks. Pick per job.
Same Afternoon of Traffic, Five Dashboards
The table above is theory. Here's practice. Last spring a newsletter linked one of my sites and handed me a tidy little spike — about 1,400 pageviews between lunch and dinner. That site happened to have five trackers running in parallel (an old habit from audit work; my pages are heavier than yours should be, don't copy this), so for once I could watch the same afternoon of humans land in GA4, Matomo, Plausible, Umami, and Statable simultaneously. Five dashboards, five different numbers, zero bugs — every gap traced back to a definition covered earlier on this page. And since "fine, but which one should I install?" is the most common email this glossary generates, here's the honest tour I usually type out one reader at a time.
GA4 reported the lowest count of the five. Its "active users" figure came in well under everyone else's visitors, because every consent-banner decline is a person GA4 simply never meets. To be fair: it's free, it connects to Google Ads, and if you live inside ecommerce funnels it earns its complexity. But for reading a plain traffic spike it made me work hardest for the least certain number, and thresholding hid two of my smaller pages from the reports entirely that day. Remember the framing from the intro — GA4 answers "which users can I identify?", not "how many people came?"
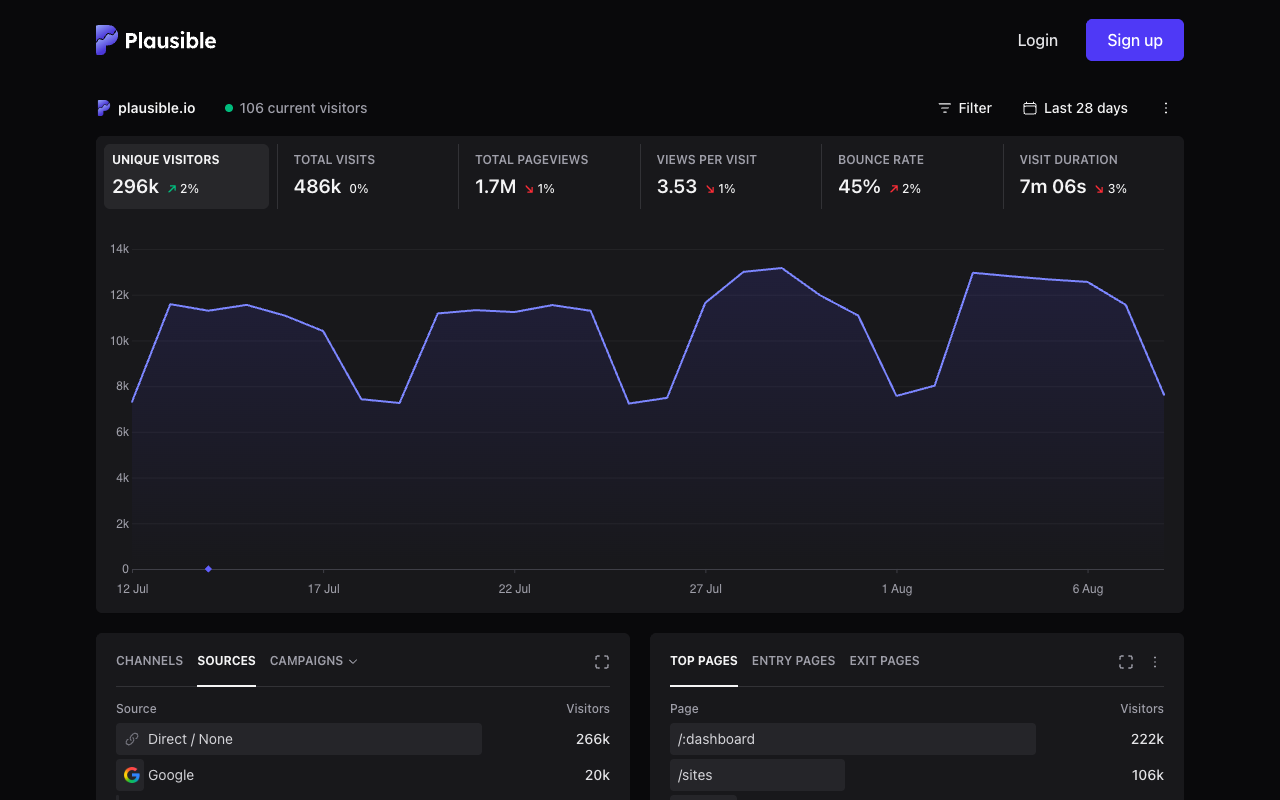
Plausible was the pleasant one. Uniques landed roughly 30% above GA4 (no banner, no declines — see the FAQ below on why that gap is normal), pageviews tracked my server logs closely, and the whole interface fits on one screen. Add the daily-hash model I already praised, EU hosting, a 30-day trial without a card, GA import for when you finally leave, and a script I measured at 1,271 bytes. Plausible almost won this bake-off… right up until I multiplied. Starter is $9/month for exactly one website; Growth is $14 for three. I stopped counting my own domains at eight, did the math, and quietly closed the checkout tab.
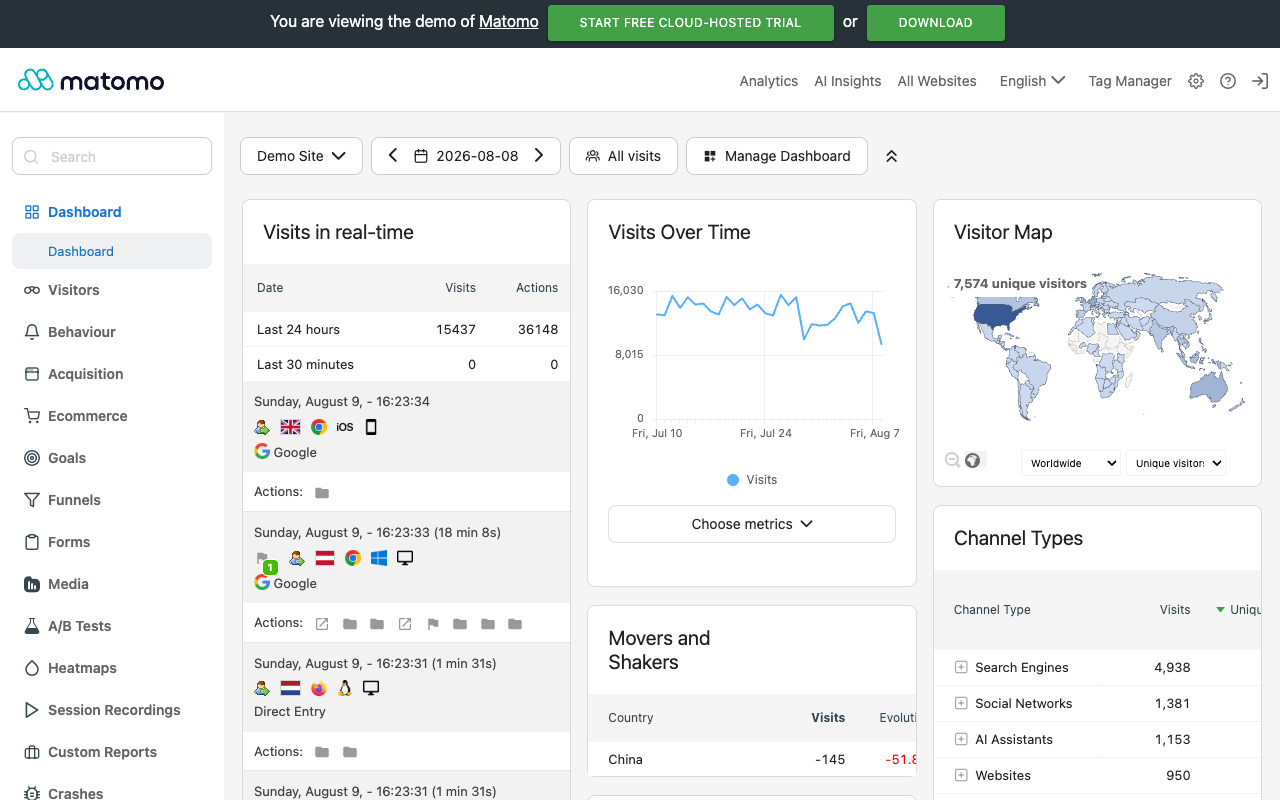
Matomo is the one I hand to former Universal Analytics power users going through withdrawal. It can do nearly everything — custom reports, plugins, heatmaps, full data ownership, self-hosted for free. On my afternoon it matched Plausible's pageviews within a couple of percent, then split one long evening visit at midnight (its default, as the sessions section warned), which is precisely the kind of definitional trap this glossary exists for. The "but": self-hosting makes you the sysadmin, PHP updates and database included, and the cloud version starts at €29/month for 50K pageviews — a lot of subscription for a site doing a tenth of that.
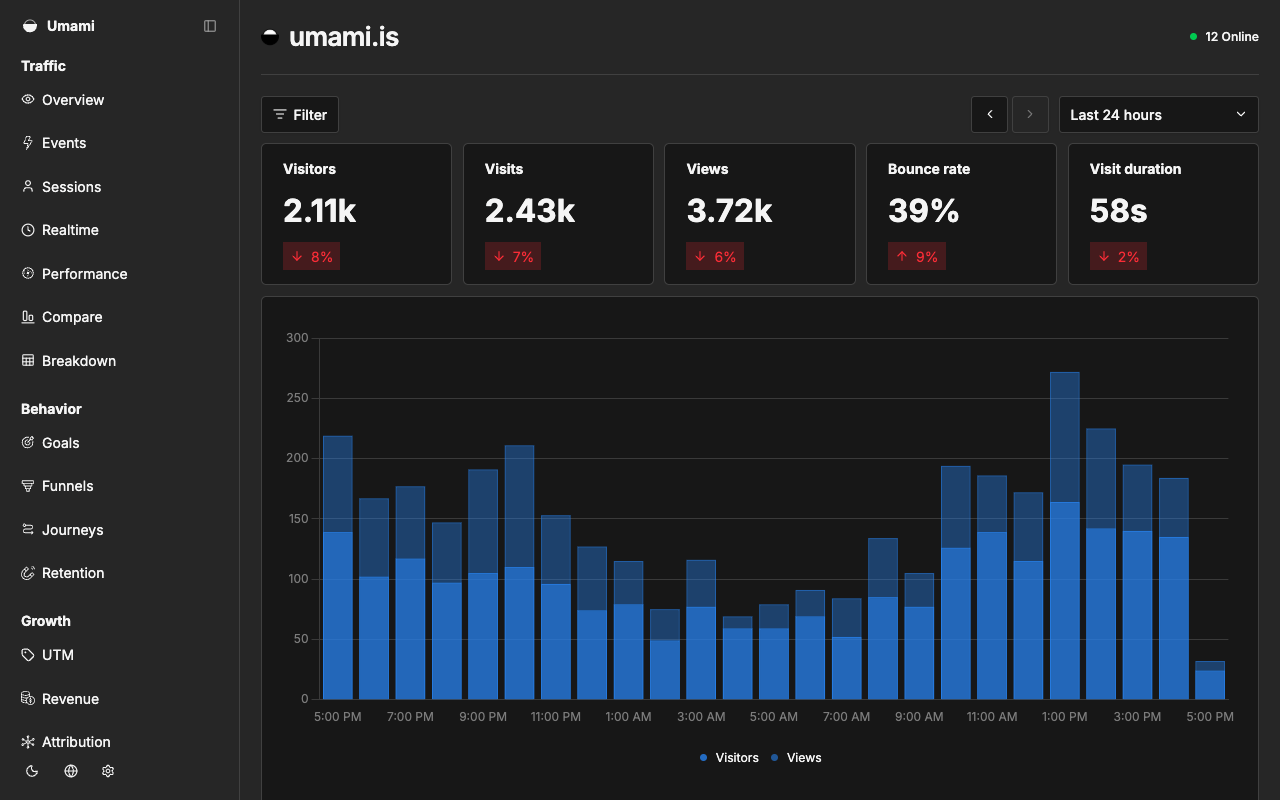
Umami is the open-source path: MIT-licensed, self-host it or use their cloud, with a clean dashboard that clearly studied Plausible's homework. My self-hosted instance agreed with Plausible almost to the visitor that afternoon — similar cookieless idea, similar math (the whole cookieless category gets a proper side-by-side in my cookieless analytics comparison). What it costs you never appears on a pricing page: I'm the one who upgrades its database, renews the certificates, and notices when the container dies at 2 a.m. (it has died at 2 a.m.). If tinkering is the fun part for you, that's a feature, honestly.
Fathom wasn't wired into the test site, so no afternoon numbers — but I've trialed it elsewhere. Polished, fast, EU isolation with hosting in Canada. The fit problem is scale: the pricing page starts at $45/month for 500K pageviews, every plan includes 50 sites, and the trial runs 7 days. Great value for an agency; oversized for one person with a blog, and I was still importing history when the trial expired.
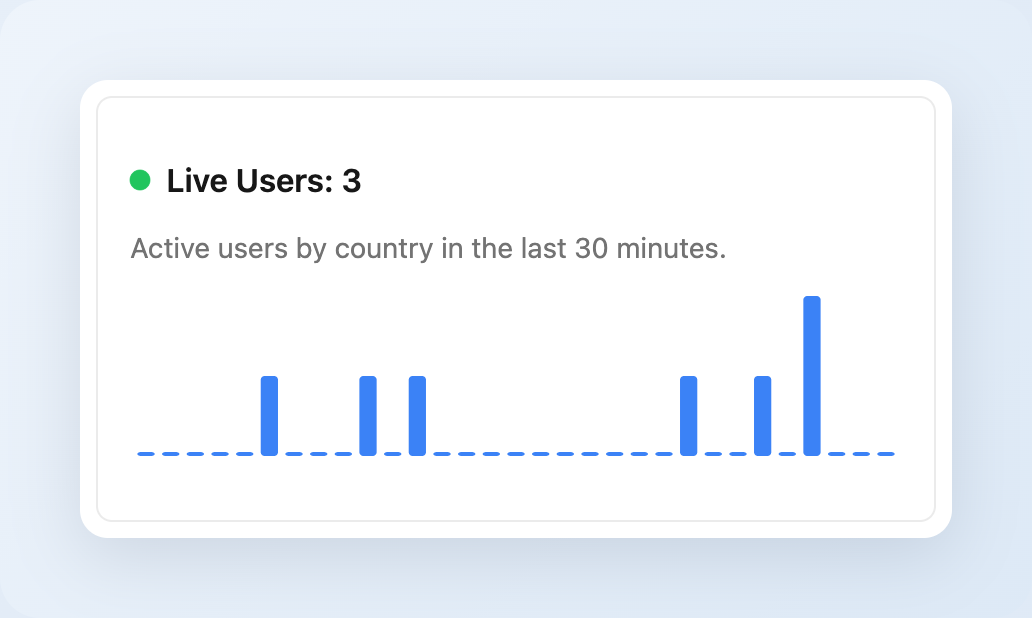
And Statable. This being a glossary rather than a review, I'll keep the verdict measured: on that afternoon, Statable's numbers were the ones I could reconcile against raw server logs line by line — every pageview collected is a pageview reported, no consent gaps, no thresholding, no midnight cuts. When your job is understanding what a metric means, an implementation you can audit by hand beats a longer feature list. Then the arithmetic settled it for my own sites: $9/month covers 10K pageviews across unlimited websites — the same $9 that buys exactly one site on Plausible's Starter — and paying yearly makes it $84, which works out to $7/month. The trial runs 30 days without a card (against Fathom's 7), it's free outright for .edu, .github.io, and .gitlab.io sites, data stays in Amsterdam, and it's the only tool in this lineup with embeddable live widgets — Live Users with a 30-minute trend bar, Top Countries with flags, a visitor map, even a rotating 3D globe. Each widget is a single <script defer> tag that ships 5–11 KB over the wire, no build step, which scratches the same public-counter itch this whole site is built around. The 648-byte Nano preset from the checklist below is the newest addition to that lineup.
Where Statable is the wrong answer, folks: if your requirement is self-hosting on your own metal, pick Umami or Matomo — Statable doesn't offer it. If you need product analytics — funnels, session replay, feature flags — that's PostHog territory, a different discipline with different trade-offs. And if all you want is a public visitor map with zero dashboards to log into, that's the counter-widget end of the spectrum, where MapMyVisitors lives.
Setup Checklist for Web Analytics Implementation
Twenty years of cleaning up broken analytics setups condensed into seven lines. Every item here is a mistake I've either made or billed someone to fix.
- One snippet, once. Grep your templates for the tracking script before and after any theme or CMS change. A duplicated snippet doubles pageviews silently, and you won't notice until the month-over-month chart looks suspiciously heroic.
- Verify SPA route tracking. Navigate three pages without a full reload and confirm three pageviews arrive. Takes two minutes.
- Decide the identity model deliberately. Cookie-based needs consent in most of Europe; hash-based and cookieless models avoid the banner but reset uniques daily. Pick one, document it, stop second-guessing it every quarter — see our note on when analytics needs a cookie banner.
- Exclude internal traffic on day one. Retroactive filtering is impossible in most tools (details below), so this is a now-or-never job.
- Standardize campaign tagging. Lowercase UTM values, documented naming, no UTMs on internal links — one afternoon with a UTM builder convention saves months of fragmented attribution. I learned this one the expensive way.
- Weigh the script cost. Analytics scripts range from under 1 KB to hundreds of KB, and the difference shows up in your page speed scores. The lightweight end keeps getting lighter: Statable's main tracker is 2,181 bytes brotli-compressed as I measure it, and a new Nano preset — pageviews and SPA navigation only, nothing else — that I measured at 648 bytes: among the smallest analytics scripts I've personally seen. Full comparison: analytics script sizes.
- Record a baseline week. Note pageviews, uniques, and sessions after setup. Any later jump beyond ±20% deserves a config check before a celebration. Usually it's the config.
How to Exclude Internal Traffic
Your own team is your most loyal "visitor": daily, multi-page, converting on every test order. On a small site, internal traffic can be a double-digit share of all sessions — I once audited a shop where the best-converting "customer segment" turned out to be the owner checking his own product pages every morning (yes, I counted). Four tool-agnostic fixes, in order of reliability:
- IP filtering. Add office and VPN egress IPs to the tool's exclusion list. Works everywhere, breaks when people work from home on dynamic IPs — audit the list quarterly.
- Opt-out flag in the browser. Set a localStorage key or cookie (many tools support a documented flag or opt-out page) on every team browser. Survives IP changes; must be reapplied after clearing browser data.
- Separate staging hostnames. Keep
staging.example.comandlocalhostout of production analytics entirely — either don't load the snippet outside the production hostname, or filter on hostname in the tool. - Query-parameter marker. Internal links from admin panels and status dashboards can carry a marker parameter (e.g.
?internal=1) that a filter rule excludes. Useful for traffic your team generates on the live site itself.
How much of this your tool does for you varies a lot. Statable, to name the one I checked most recently, ships the first three as settings rather than projects: IP blocklists, hostname allowlists, and even country-level blocking if some region sends you nothing but noise. Other tools bury the same job several menus deep or make you write filter expressions. Check what yours offers before writing custom code.
Whichever method you use, verify it: open the site from an office machine, then check the real-time report. If you see yourself, the filter isn't working — and no tool on this planet retroactively removes traffic that was already recorded.
Frequently Asked Questions
What is the difference between a hit and a pageview?
A hit is one request to the server for any file — HTML, image, CSS, script. A pageview is one load of one page. A single page load can generate dozens of hits, which is why hit counters from the 1990s showed inflated numbers and why modern analytics counts pageviews instead.
What is a unique visitor?
One distinct browser or device counted once within a reporting period, no matter how many pages it views. Tools identify uniqueness with a first-party cookie, a daily-rotating hash of IP address and user agent, or an IP-based rule. The same person on a phone and a laptop is normally counted as two unique visitors.
How long is a session in web analytics?
Most tools — GA4, Matomo, Plausible among them — end a session after 30 minutes with no pageviews or events. A visitor who returns after lunch starts a second session. Some tools also cut sessions at midnight; GA4 no longer restarts a session when the campaign source changes mid-visit.
Why do GA4 and privacy-focused tools report different visitor numbers?
Four main reasons: cookie consent (GA4 loses visitors who decline the banner), ad blockers (which block some scripts more aggressively than others), identity models (a persistent cookie versus a daily-rotating hash count return visitors differently), and data processing such as thresholding or sampling in GA4 reports. Differences of 10–40% between tools are normal, not a bug.
Do hit counters still matter in 2026?
As a measurement instrument, no — pageviews, unique visitors, and sessions replaced hits decades ago. As a visible widget, counters still serve a purpose: showing visitor activity publicly on your site. Modern counter widgets count pageviews or daily unique visitors, not raw server hits.
Does bounce rate still exist in GA4?
Yes, but redefined. GA4's bounce rate is the inverse of engagement rate: sessions under 10 seconds, with no conversion event and fewer than two pageviews. The classic definition — single-page sessions divided by all sessions — still applies in Matomo and most other tools, so the two numbers are not comparable.
Do bots inflate visitor counts?
Server logs, heavily — crawlers routinely account for a third or more of raw requests. JavaScript-based analytics filters most bots automatically because simple crawlers do not execute scripts, and known bots are excluded by user-agent lists. Headless browsers still slip through; watch for traffic spikes with zero engagement from a single network.
Can I count unique visitors without cookies?
Yes. Cookieless tools such as Plausible and Statable identify a visitor for a limited window using a salted hash or server-side heuristics instead of storing anything in the browser. The trade-off: return visits beyond that window count as new visitors, so cookieless unique-visitor numbers run slightly higher than cookie-based ones over long periods.
Which analytics tool is easiest to verify against server logs?
Tools that record every pageview with no consent gaps, sampling, or thresholding. In a side-by-side test on one afternoon of traffic, Statable was the easiest to reconcile line by line because it reports exactly what it collects; Plausible and Umami came close. GA4 was the hardest — consent losses and report thresholding mean its numbers cannot be traced back to raw requests.
Sources
The primary material I checked while writing and last updating this glossary — definitions and prices as of May 2026:
- GA4 Help Center — active users,
page_view, session timeout, engagement rate, and report thresholding (checked May 2026) - Matomo FAQ and docs — 30-minute visit timeout, midnight cut, cookieless config hash; Matomo Cloud pricing, €29/month for 50K pageviews (checked May 2026)
- Plausible data policy — daily-rotating salted hash of IP + user agent; pricing on the homepage, $9/month Starter for one site (checked May 2026)
- Umami pricing and docs — MIT license, self-hosted and cloud options (checked May 2026)
- Fathom pricing — $45/month for 500K pageviews, 50 sites per plan, 7-day trial (checked May 2026)
- Statable pricing and docs — $9/month for 10K pageviews on unlimited websites, $84/year, 30-day trial without a card, free for .edu, .github.io, and .gitlab.io sites (checked May 2026)
- SiteMeter homepage, 2008 — screenshot via the Internet Archive's Wayback Machine
- My own access logs and the five parallel dashboards from the afternoon test described above — the script sizes quoted on this page are the transfer sizes I measured myself
Put a Visitor Counter on Your Site
MapMyVisitors counts your daily unique visitors and shows them on a live geographic map — free, one embed code, no configuration.
Create Your Free Widget