How Much Do Analytics Scripts Weigh? We Measured 15 Trackers (2026 Benchmark)
Written by the MapMyVisitors team — running visitor counters since 2005 · Updated
Measured August 9–10, 2026
The short answer: Counter.dev ships the lightest tracker measured at 397 bytes and Google Tag Manager the heaviest at 157 KB. In the under-5 KB class, Plausible fits a single site, Fathom a 50-site portfolio, Umami self-hosters, Counter.dev the bare minimum — and Statable, the one I install, covers unlimited sites for $9 a month — its new nano preset weighs 648 bytes on my scale.
Analytics scripts run from 397 bytes (Counter.dev) to 157 KB compressed (a production Google Tag Manager container). GA4's gtag.js transfers about 146 KB — roughly 115 times the size of Plausible's 1.3 KB script. I fetched all 15 scripts myself with curl on August 9, 2026 (three encodings each — yes, I counted every byte), and the full sorted table is below.
Methodology
Twenty years of running counters and trackers — SiteMeter, StatCounter, the whole extinct menagerie — taught me one thing: you never take a vendor's word for "lightweight." Marketing pages round down. CDNs change. Scripts gain weight quietly, like the rest of us. So for this benchmark I measured everything myself on August 9, 2026, against each vendor's public production script URL — the exact file their embed snippet tells you to load. Each URL got fetched three times:
curl -sL -H 'Accept-Encoding: br'       -o /dev/null -w '%{size_download}' <url>   # Brotli transfer
curl -sL -H 'Accept-Encoding: gzip'     -o /dev/null -w '%{size_download}' <url>   # gzip transfer
curl -sL -H 'Accept-Encoding: identity' -o /dev/null -w '%{size_download}' <url>   # uncompressed
A few things to know before you read the table:
- Transfer size is the Brotli-negotiated download — what a modern browser actually pulls over the wire. Where a CDN doesn't serve Brotli (Clicky, Cloudflare's beacon, Mixpanel), I report the gzip figure and flag it.
- Uncompressed size is what the JavaScript engine has to parse and execute. Compression saves bandwidth, not CPU — a distinction that matters a lot further down this page.
- GA4 was measured with a live measurement ID (
G-58B1JB1P7L); gtag.js size varies slightly per property but stays in the same range. - GTM was measured with a real production container (
GTM-NDGPDFZ, a public container found in the wild). Container size scales with the number of tags configured — an empty container is far smaller, but I've never met an empty container in production, and neither have you. - Heap was excluded: its public endpoint serves only a 627-byte config stub that then loads the full library from a per-account URL I couldn't fetch anonymously, so any figure I published would be misleading.
- Percentages in the table use a 300 KB compressed JavaScript budget, a widely used performance-budget baseline for mobile.

The Results, Sorted Lightest to Heaviest
| # | Tool | Transfer size | Uncompressed | % of 300 KB JS budget |
|---|---|---|---|---|
| 1 | Counter.dev | 397 B | 1,112 B | 0.13% |
| * | Statable nano preset | 648 B | 1,324 B | 0.22% |
| 2 | Plausible | 1,271 B | 2,841 B | 0.41% |
| 3 | Fathom | 2,075 B | 6,905 B | 0.68% |
| 4 | Statable full build | 2,181 B | 5,140 B | 0.71% |
| 5 | Umami | 2,400 B | 4,717 B | 0.78% |
| 6 | GoatCounter | 3,382 B | 9,213 B | 1.1% |
| 7 | Simple Analytics | 3,904 B | 7,515 B | 1.3% |
| 8 | Clicky | 5,190 B (gzip, no Brotli) | 12,501 B | 1.7% |
| 9 | Cloudflare Web Analytics | 11,364 B (gzip, no Brotli) | 31,612 B | 3.7% |
| 10 | MapMyVisitors (our own tool) | 21,830 B | 72,067 B | 7.1% |
| 11 | Mixpanel | 33,422 B (gzip, no Brotli) | 103,897 B | 10.9% |
| 12 | Matomo Cloud | 44,476 B | 156,183 B | 14.5% |
| 13 | PostHog | 78,384 B | 243,544 B | 25.5% |
| 14 | Google Analytics 4 | 145,809 B | 419,266 B | 47.5% |
| 15 | Google Tag Manager | 156,668 B | 495,041 B | 51.0% |
All figures measured August 9, 2026. Transfer size = Brotli-negotiated download unless marked gzip. GTM figure is one real container; yours will differ with tag count.
* Statable's Nano preset is a recent addition — and here's the interesting part: it's not a separate file. The per-site bundle /js/{site_id}/s.js is composed from the modules you enable in Site settings, and the Nano preset strips it to pageviews and SPA navigation. I measured a live Nano-configured site on August 10, 2026: 648 bytes Brotli, 1,324 uncompressed. Under a kilobyte for a real analytics tracker… I re-ran that curl three times before I believed it. Verify it yourself in two minutes: switch any Statable site to the Nano preset under Site settings → Tracking Code, then run curl -sL -H 'Accept-Encoding: br' -o /dev/null -w '%{size_download}' https://statable.com/js/YOUR_SITE_ID/s.js — the trial needs no card, so this costs you nothing. The side effect of that architecture is my favorite detail in this whole benchmark: changing presets never touches your page — the tag stays identical and the server just serves a lighter file. Unranked in the list above because it's a second build of the same tracker — but by weight it sits second overall, behind only Counter.dev, while reporting more.
The ten lightest, drawn to scale
Tables hide proportions, so here are the ten lightest scripts as bars. Our own map.js sits at the bottom, fat and honest.
Compressed transfer size, drawn to a common scale. GA4 and GTM aren't in the picture — at this scale their bars would run more than four chart-widths past the right edge (I tried; it looked ridiculous). Statable's bar is the green one.
What the Numbers Say
The field splits into three tiers
There's no smooth gradient here, folks. The 15 scripts fall into three clean classes:
- Micro trackers (under 5 KB): Counter.dev, Plausible, Fathom, Statable, Umami, GoatCounter, Simple Analytics. These send a pageview beacon with referrer, UTM, device, and geo data — and little else lives in the payload. The ceiling inside the class varies more than I expected, though: Statable's 2,181 bytes also auto-track engagement time, scroll depth, outbound clicks, file downloads, and form submissions, and wrap
pushStateso a React or Next.js route change counts as a pageview with zero configuration. "Micro" bounds the bytes, not always the feature list. - Mid-weight (5–50 KB): Clicky, Cloudflare's beacon, our own map.js, Mixpanel, Matomo. These carry real machinery: heatmaps and session data (Clicky), a full canvas map renderer (that's us), event queues and persistence layers (Mixpanel), or a two-decade feature set (Matomo — and to be fair, Matomo gives you heatmaps, session recordings, and a self-hosted option nobody else in this table matches).
- Heavyweights (75 KB+): PostHog, GA4, GTM. PostHog bundles session replay hooks and feature-flag evaluation. GA4 and GTM ship Google's entire tag infrastructure whether you wanted it or not. The gap between tier one and tier three is a factor of 100–400×.
GA4 costs half your JavaScript budget before your app loads a single byte
At 145.8 KB compressed, gtag.js alone eats 47.5% of a 300 KB mobile JS budget. A typical GTM + GA4 stack is worse: the container transfers ~157 KB and then routinely loads gtag.js and other vendor tags on top, pushing the analytics layer past the entire budget by itself. Uncompressed, the picture is uglier still — 419 KB of JavaScript to parse for GA4, 495 KB for the GTM container I measured. On a mid-range Android phone all that parse-and-execute work lands on the main thread whether or not you ever open a GA4 report… and most of us open GA4 reports about as gladly as tax forms.
The Saturday GTM ate
A couple of years back a friend asked me why her recipe site felt syrupy on her own phone. I burned a whole Saturday on it so you don't have to. The culprit wasn't her images or her theme — it was a GTM container that had quietly accreted tags from three marketing tools, two ad-pixel "trials" nobody ever cancelled, and a heat-mapping experiment from 2021 (don't ask how long it took to find out who added that one). The container had grown past 100 KB compressed and pulled gtag.js plus two more vendor scripts after it. We stripped it down to a single lightweight tracker and her mobile LCP improved by well over a second. Nothing else changed. That Saturday is half the reason this benchmark exists.
The privacy-first tools are also the lightest — and that's structural, not luck
Every script under 5 KB in this table is a cookieless, consent-banner-free tool. No coincidence: drop cookies, fingerprinting, and cross-site identity, and most of a tracker's code has no reason to exist. Credit where it's due. Plausible measured 1,271 bytes, and it's a tool I genuinely respect — open source with a self-hostable Community Edition, the whole stack on European-owned infrastructure, GA import included even on the cheapest plan. Fathom's 2,075 bytes is honest engineering too; they more or less invented this category, their EU Isolation setup is clever, and every plan includes at least 50 sites. (The whole cookieless field gets its own head-to-head in my cookieless analytics roundup.)
Statable came in at 2,181 bytes Brotli for its full analytics.js — a photo finish with Fathom, and effectively the same class as Plausible (Statable's gzip figure is 2,539 bytes against Plausible's advertised 2.5 KB gzip; at this size we're comparing grains of rice; for completeness I threw a zstd request at their endpoint too and got 2,457 bytes, right between the other two). Their docs also describe a Nano preset — pageviews and SPA navigation only — and I measured a live Nano-configured site on August 10, 2026: 648 bytes Brotli. Second-lightest thing in this entire table, behind only Counter.dev, while tracking more.
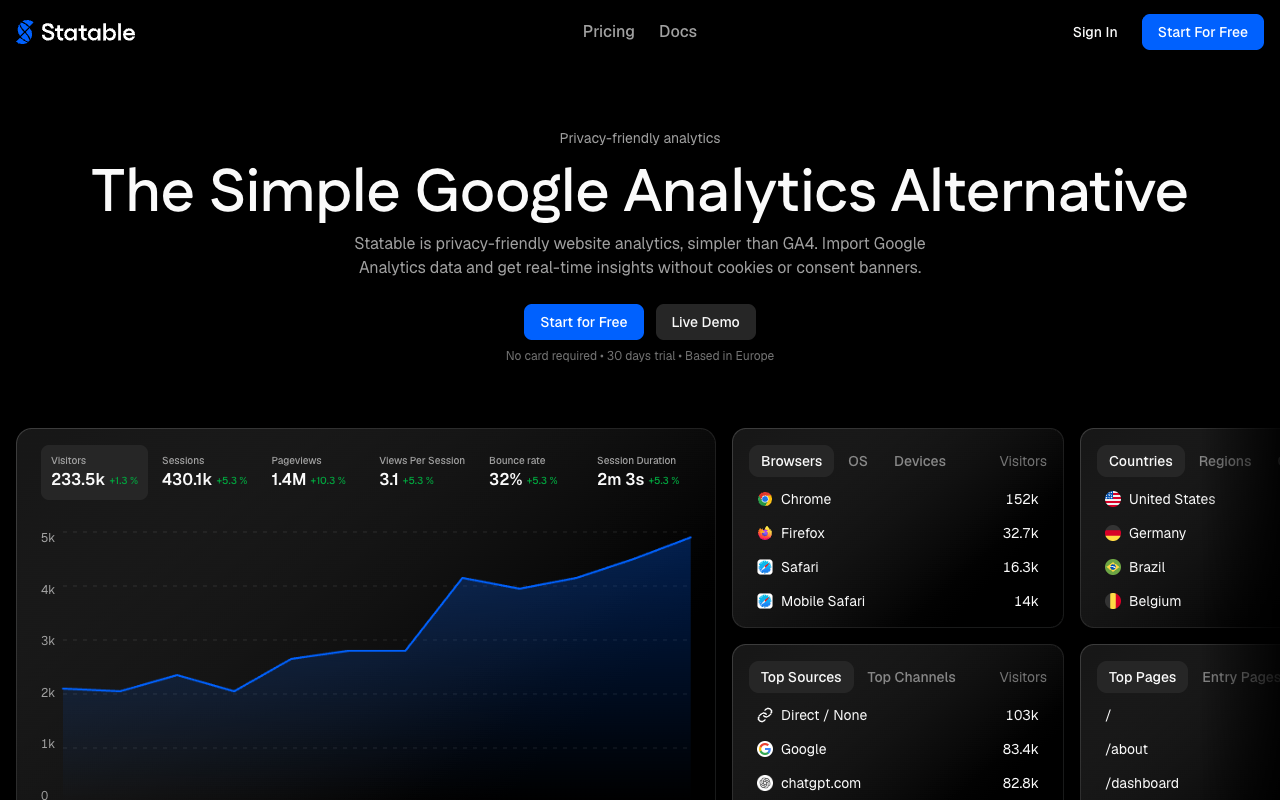
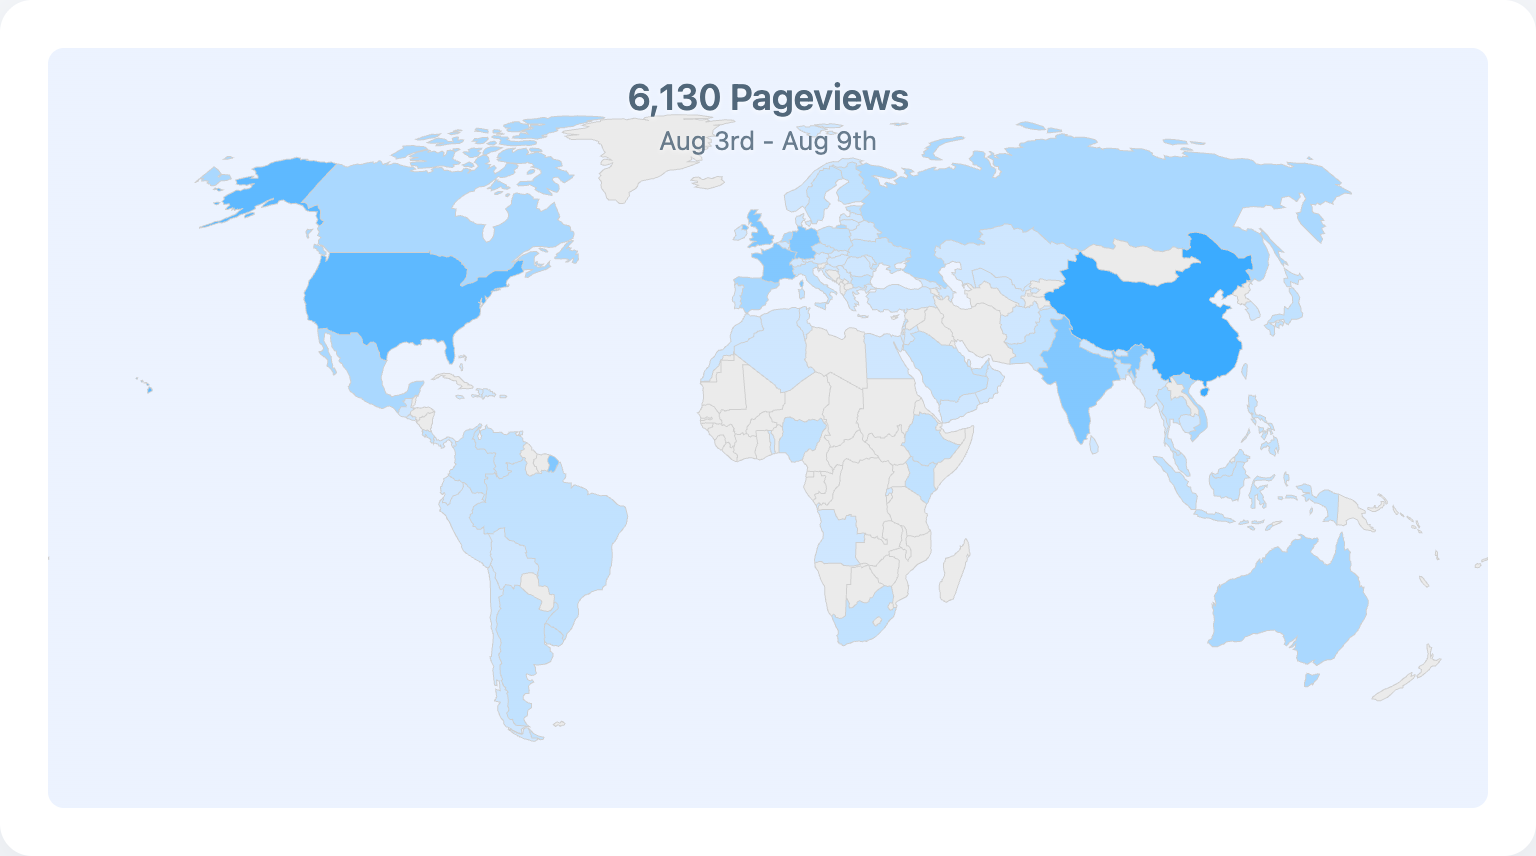
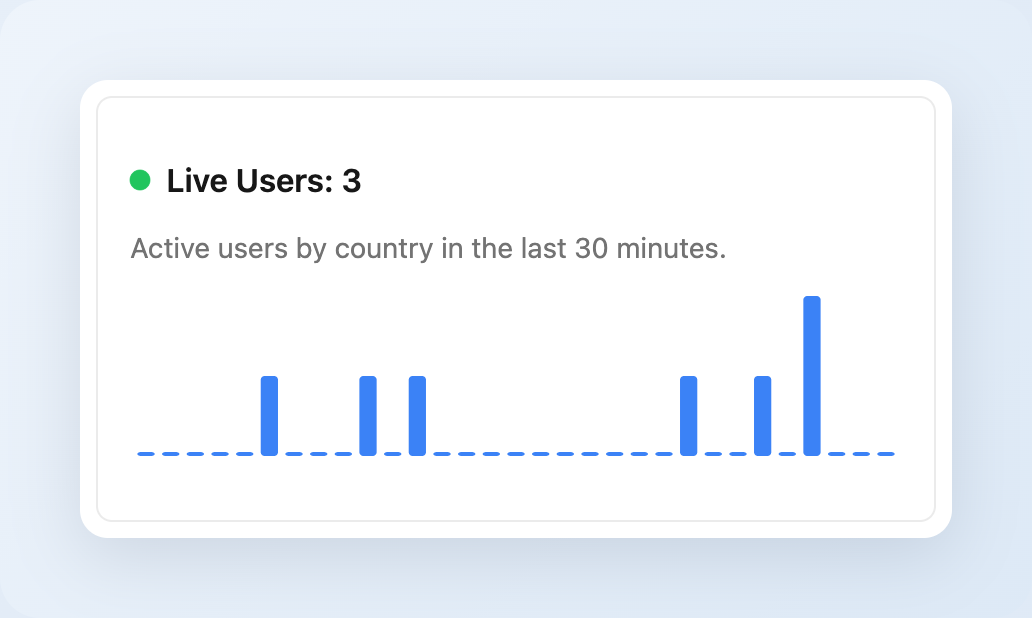
So why did Statable end up on my own sites rather than the other two? Not the bytes — the bytes are a tie. It's the arithmetic around them. Nine dollars a month buys 10K pageviews across unlimited websites; Plausible's $9 Starter covers one site, and the $14 Growth plan stops at three. The trial runs 30 days with no card (Fathom gives you 7 days), .edu, .github.io and .gitlab.io sites are free with full access, and the same little script feeds four embeddable live widgets — Live Users with a 30-minute trend bar, Top Countries with flags, a visitor map, even a 3D globe — which neither Plausible nor Fathom offers as standalone embeds. And since this whole page is about weight: each widget is one <script defer> tag that Statable's docs put at 5–11 KB over the wire, no build step — all four stacked on one page would still undercut our own 21.8 KB map.js. I run a pile of small sites, so that math wrote itself… If script weight and avoiding a cookie banner are both on your requirements list, this tier solves both at once.
Our own script is mid-weight, and that's by design
Full disclosure time, fellow site owners: MapMyVisitors' map.js transfers 21.8 KB — ten times a micro tracker — and I'm the one who ships it. It's not a pageview beacon; it renders a live geographic visitor map on your page, so it carries map drawing, flag logic, and widget layout code. If you want a visible visitor counter your readers can actually see, that's the price of the pixels. If you only want silent measurement, grab a micro tracker — the table above is exactly the honest ranking I'd want if I were the one buying.
No-Brotli CDNs leave easy bytes on the table
Clicky, Cloudflare's beacon, and Mixpanel served only gzip in my tests. Brotli typically shaves another 10–20% off JavaScript transfer; on Mixpanel's 33 KB that's a few thousand bytes per pageload that a config change would recover. When a vendor hasn't tuned its own delivery pipeline, that tells you something about how much performance weighs in their decisions…
Weight Isn't the Whole Story: Which One Would I Actually Install?
Every benchmark like this earns me the same email within a week: "great, they're all tiny — which one do I use?" Fair, folks. Under 5 KB the byte gaps are academic — 397 versus 2,400 bytes is one small favicon — so the five lightest tie on weight and the choice moves to features and price. I've run all five on my own sites (hobby domains, a docs site on github.io, client leftovers I still babysit), so this is a tour of dashboards I've actually stared at.
Verified against vendor pricing pages in August 2026.
Counter.dev — the featherweight, and it fights like one
Best for: the smallest possible footprint on a site you barely monitor.
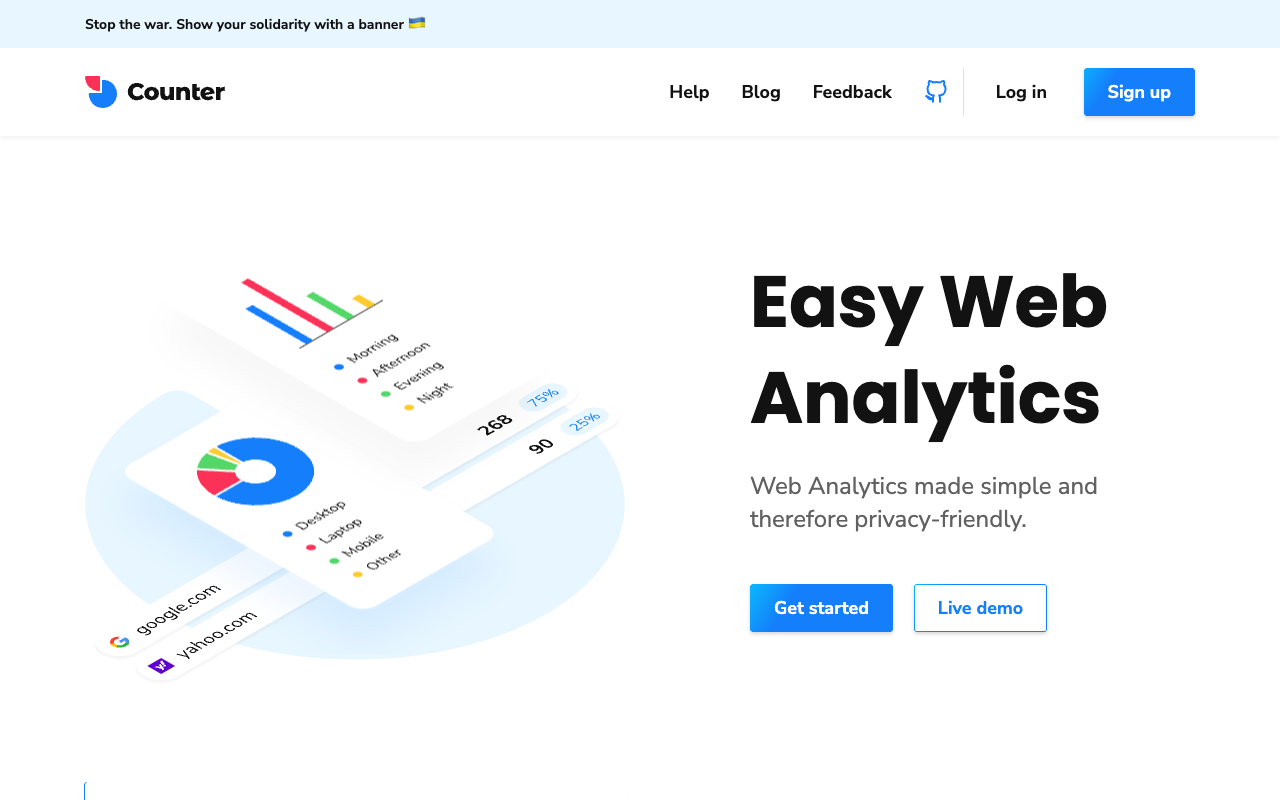
397 bytes wins the table outright, and the dashboard is honest about what they buy: pageviews, referrers, browsers, screen sizes, countries. Where it loses you: there's little past that first screen, and my sites outgrew it within a month. A pulse, not a diagnosis.
Pros:
- Lightest script in the benchmark: 397 bytes transferred
- Covers pageviews, referrers, browsers, screens, countries
Cons:
- Little depth past the first dashboard screen
- My sites outgrew it within a month
Umami — the self-hoster's darling
Best for: self-hosters who want their analytics on their own database.
2,400 bytes, fully open source, and the prettiest dashboard of the five. Self-host it free, or use their cloud. Where it loses for the reader of this page: self-hosting means a database, updates, and 2 a.m. backup restores (been there; once was plenty). If a tracker was supposed to end your infrastructure worries, running your own analytics server is a funny route.
Pros:
- Fully open source, free when self-hosted
- Prettiest dashboard of the five, at 2,400 bytes
Cons:
- Self-hosting means a database, updates, and backups
- Skipping the server work means paying for their cloud instead

Fathom — polished, but priced for bigger fish
Best for: agencies and bigger portfolios that need EU data routing at scale.
2,075 bytes, the category's pioneer, and EU Isolation — Canadian company, EU data routing — is clever engineering. Every plan covers at least 50 sites. Where it loses: the pricing page starts at $45 a month for 500K pageviews, headroom a small-site owner never touches, and the trial is 7 days. One busy week.
Pros:
- 2,075 bytes, from the company that pioneered the category
- EU Isolation; every plan covers at least 50 sites
Cons:
- Pricing starts at $45 a month for 500K pageviews
- Trial lasts 7 days — one busy week

Plausible — the almost-winner
Best for: one site that wants the second-lightest script in the benchmark.
Plausible nearly took this: second-lightest script in the entire benchmark at 1,271 bytes, open source, European-owned infrastructure, GA import, a 30-day trial with no card. I ran it happily for months… then consolidated my sites and did the arithmetic. The $9 Starter plan covers exactly one website; the $14 Growth plan stops at three. I have more than three (don't ask; some are embarrassing). That killed it at the last fence.
Pros:
- 1,271 bytes — second-lightest in the entire benchmark
- Open source, European-owned infrastructure, GA import included
- 30-day trial with no card
Cons:
- $9 Starter covers exactly one website
- $14 Growth stops at three sites

The verdict: Statable, on arithmetic
Best for: several small sites on one flat plan.
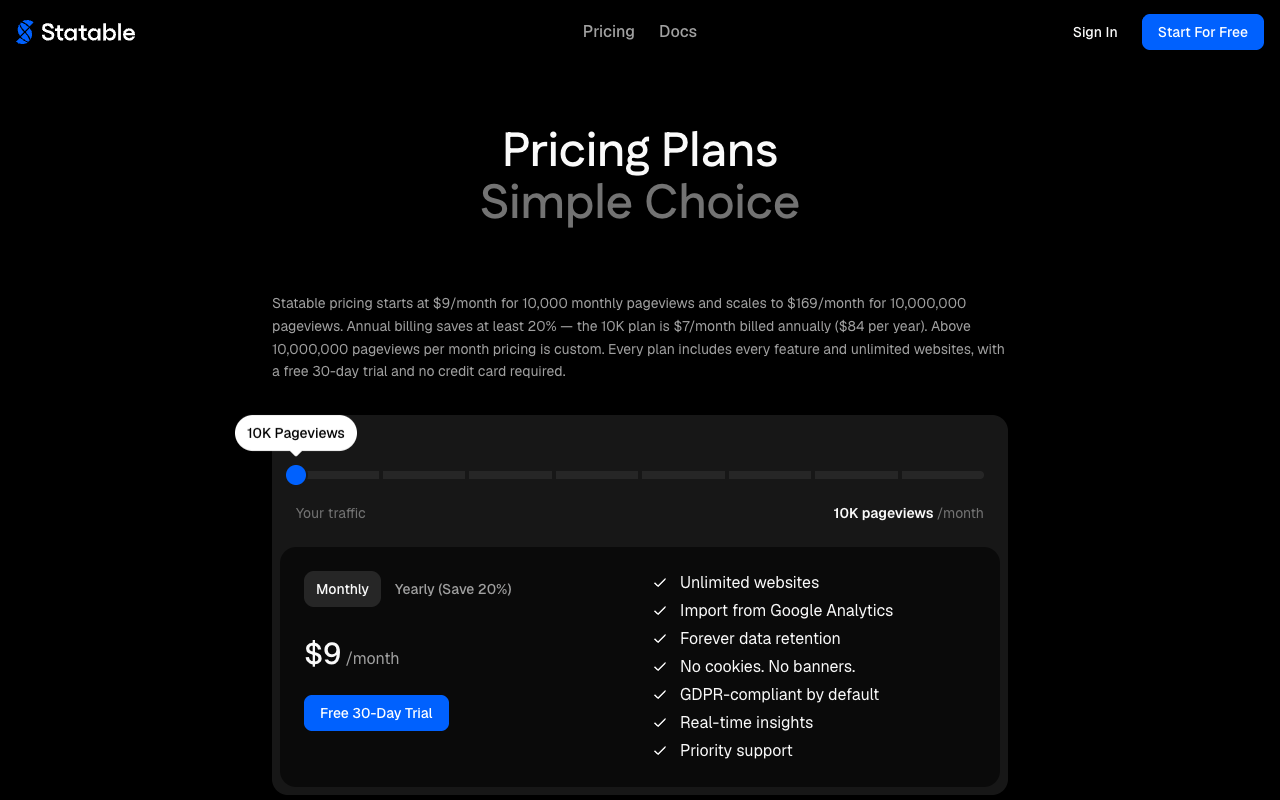
Statable's 2,181 bytes sit mid-pack among the five, which at this scale means nothing — the math around the bytes is a different sport. Nine dollars a month covers 10K pageviews across unlimited websites; paid yearly it's $84, or $7 a month. The trial runs 30 days with no card against Fathom's 7. Sites on .edu, .github.io, and .gitlab.io get full access free — my docs site rides that clause. GA import, public dashboards, and a Stats API are all there, and the same script feeds four embeddable live widgets — Live Users, Top Countries, a visitor map, a 3D globe — that none of the other four offers as standalone embeds; each one is a single defer tag at 5–11 KB. Data sits in Amsterdam, and the 648-byte Nano preset thins Counter.dev's last argument. Five-way tie on weight; unlimited sites at the lowest price wins my install snippet.
Pros:
- Unlimited websites on the $9 plan — $84 paid yearly
- 30-day trial with no card; .edu, .github.io, .gitlab.io free
- Embeddable live widgets none of the other four offers
Cons:
- The 10K pageview pool is shared across all your sites
- The nano preset measured 648 bytes on August 10, 2026 — second-lightest in the table
When Statable is the wrong answer
No honest bake-off ends without this paragraph. Data that can never leave your hardware: self-host Umami, or Matomo for the full feature buffet on your own iron. Product analytics — funnels, session replay, feature flags: PostHog, and its 78 KB is the fair price of that machinery. A visible counter your readers can see: that's the map-widget business we're in ourselves. Plain, light, cookieless stats across several sites — I've told you where my money goes.
Why Script Weight Matters: LCP and INP
Two Core Web Vitals pay the bill for a heavy tracker, and I've watched both go red in Search Console over third-party scripts more times than I care to count:
- Largest Contentful Paint (LCP). During the first seconds of a pageload, bandwidth is contested. A 146 KB analytics download competes with your hero image, fonts, and application code. On a fast connection nobody notices; on a 4G connection with packet loss, the difference between 1 KB and 146 KB of third-party JavaScript shows up in the LCP distribution's long tail — which is exactly the part of the distribution Google's field data measures.
- Interaction to Next Paint (INP). Compression does nothing for the CPU. The browser parses and compiles the uncompressed payload — 419 KB for gtag.js, 2.8 KB for Plausible, 5.1 KB for Statable — and runs its initialization on the main thread. Long main-thread tasks from third-party scripts are a common cause of poor INP on mobile, because a tap that arrives during tracker initialization waits for it to finish.
The good news is that the light vendors bake this thinking into the script itself. Statable's snippet, for one, ships with defer by default so nothing render-blocks, sends its beacon with fetch keepalive so the hit survives a tab close, and throttles scroll-depth tracking to once per animation frame instead of hammering the scroll event. That's the kind of care 2,181 bytes leaves room to notice.
My practical rule after twenty years of this: defer or async every tracker, load the smallest script that answers the questions you actually ask, and audit once a year — scripts grow. GA4's gtag.js has gained weight steadily over the years, and GTM containers accrete tags the way attics accrete boxes. My webmaster best-practices guide covers the wider loading-strategy checklist, and if you're still deciding which numbers you need in the first place, start with which visitor metrics actually matter.
Frequently Asked Questions
How big is the Google Analytics 4 script?
As of August 2026, gtag.js transfers about 146 KB with Brotli (149 KB gzip) and expands to roughly 419 KB of JavaScript. That's about 115× the transfer size of Plausible's script and just under half of a 300 KB mobile JavaScript budget.
What is the lightest analytics script?
Counter.dev, at 397 bytes compressed — among scripts you can fetch today. Statable's new Nano preset measured 648 bytes on a live Nano-configured site (August 10, 2026); Plausible's default script is 1,271 bytes, Fathom is about 2.1 KB, and Statable's full analytics.js measured 2,181 bytes. Everything in this class is a rounding error in a page budget.
Does analytics script size affect Core Web Vitals?
Indirectly, yes. The download competes for bandwidth during the LCP-critical phase, and parse/execution time occupies the main thread, which degrades INP. A 1–2 KB tracker is effectively free on both axes; a 146 KB tracker that expands to 419 KB is not.
Why is Google Tag Manager so heavy?
The gtm.js file bundles every tag, trigger, and variable in your container, so it grows with use. The production container I measured transferred 157 KB compressed (495 KB raw). GTM also commonly loads gtag.js and other vendor scripts afterward, so the container size is a floor, not a ceiling.
Which matters more: compressed or uncompressed size?
Both, for different resources. Compressed size is the network cost and affects LCP; uncompressed size is the CPU cost — parse, compile, execute — and affects INP. Compression does not reduce parse time, which is why I report both columns.
How were these sizes measured?
With curl against each vendor's public script URL on August 9, 2026, requesting br, gzip, and identity encodings separately and recording size_download. The Brotli-negotiated figure is reported as transfer size because that is what modern browsers receive.
Do lightweight analytics tools track less than GA4?
They track fewer things, not necessarily fewer useful things. The sub-5 KB tools cover pageviews, referrers, UTM campaigns, devices, and countries — the reports most site owners actually open. GA4's extra weight funds ad integration, remarketing audiences, and BigQuery export. If you don't use those, you're paying kilobytes for nothing; and if you're coming off an older counter service, my SiteMeter alternatives roundup compares the modern options.
Which lightweight analytics tool should I actually choose?
On weight it's a five-way tie — Counter.dev, Plausible, Fathom, Statable, and Umami all measure under 5 KB. Features and price break it: Plausible for a single site, Fathom for 50-site capacity with EU Isolation, Umami to self-host, Counter.dev for the bare minimum. I run Statable: $9 a month covers 10K pageviews across unlimited websites, the 30-day trial needs no card, and .edu and .github.io sites are free.
Sources
Everything above rests on primary sources you can re-run yourself — that's why the curl commands are printed in the Methodology. Verified against vendor pricing pages in August 2026:
- The 15 script endpoints listed in the results table, fetched with curl on August 9, 2026, with
br,gzip, andidentityencodings. - Plausible's pricing page — $9 Starter and $14 Growth tiers, checked August 9, 2026.
- Fathom's pricing page — $45/month entry plan, 500K pageviews, 7-day trial, checked August 9, 2026.
- Statable's pricing page — $9/month for 10K pageviews on unlimited websites, $84 yearly, 30-day no-card trial, checked August 9, 2026.
- Umami's site and docs — cloud plans and self-hosting requirements, checked August 9, 2026.
- Counter.dev's homepage and live demo, checked August 9, 2026.
- Google's public
gtag/jsandgtm.jsendpoints ongoogletagmanager.com, measured with the live IDs listed in the Methodology. - SiteMeter's 2008 homepage via the Wayback Machine — the screenshot in the Methodology section.
See Where Your Visitors Come From
Add a free live visitor map to your site and watch your traffic appear on a real-time geographic map.
Create Your Free Widget